In performance testing, simulating real-world user behavior is essential to accurately evaluate an application’s capacity and responsiveness. The Throughput Controller in Apache JMeter plays a pivotal role in achieving this realism by controlling the frequency of specific actions within a test plan. It allows testers to distribute the load intelligently, ensuring that test scenarios reflect the varying behavior of users interacting with the application.
Imagine having three APIs; we can distribute the workload among them by assigning 40% of the requests to the first API and 30% each to the second and third APIs.
Note: We have also attached a video at the end of this article. In case you are more comfortable with the video version, please feel free to have a look
When and why to use Throughput Controller
- Mimicking Real-World Usage Patterns: Not all user actions occur with the same frequency. For instance, browsing might happen more often than completing a transaction. The Throughput Controller helps replicate these varied action frequencies, ensuring your test mirrors actual user behavior.
- Efficient Load Distribution: It enables precise control over load distribution across different requests or user actions, helping you identify potential bottlenecks in high-priority areas.
Let’s now see, how we can add the Throughput controller in Jmeter and effectively use it.
- Set up a Test Plan
- Create a Thread Group
- Add Throughput controller
- Throughput controller configuration
Let’s look at the above steps one by one.
Set up a Test Plan
- Launch JMeter.
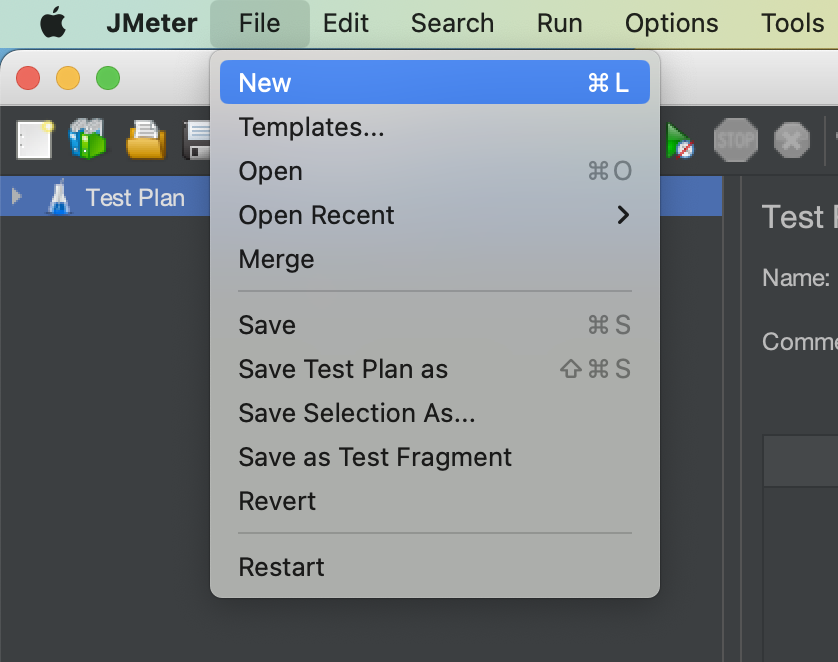
- Go to the “File” Menu and select “New”.
- This will create a new test plan to be used in our example.

Create a Thread Group
- Right-click on the Test Plan.
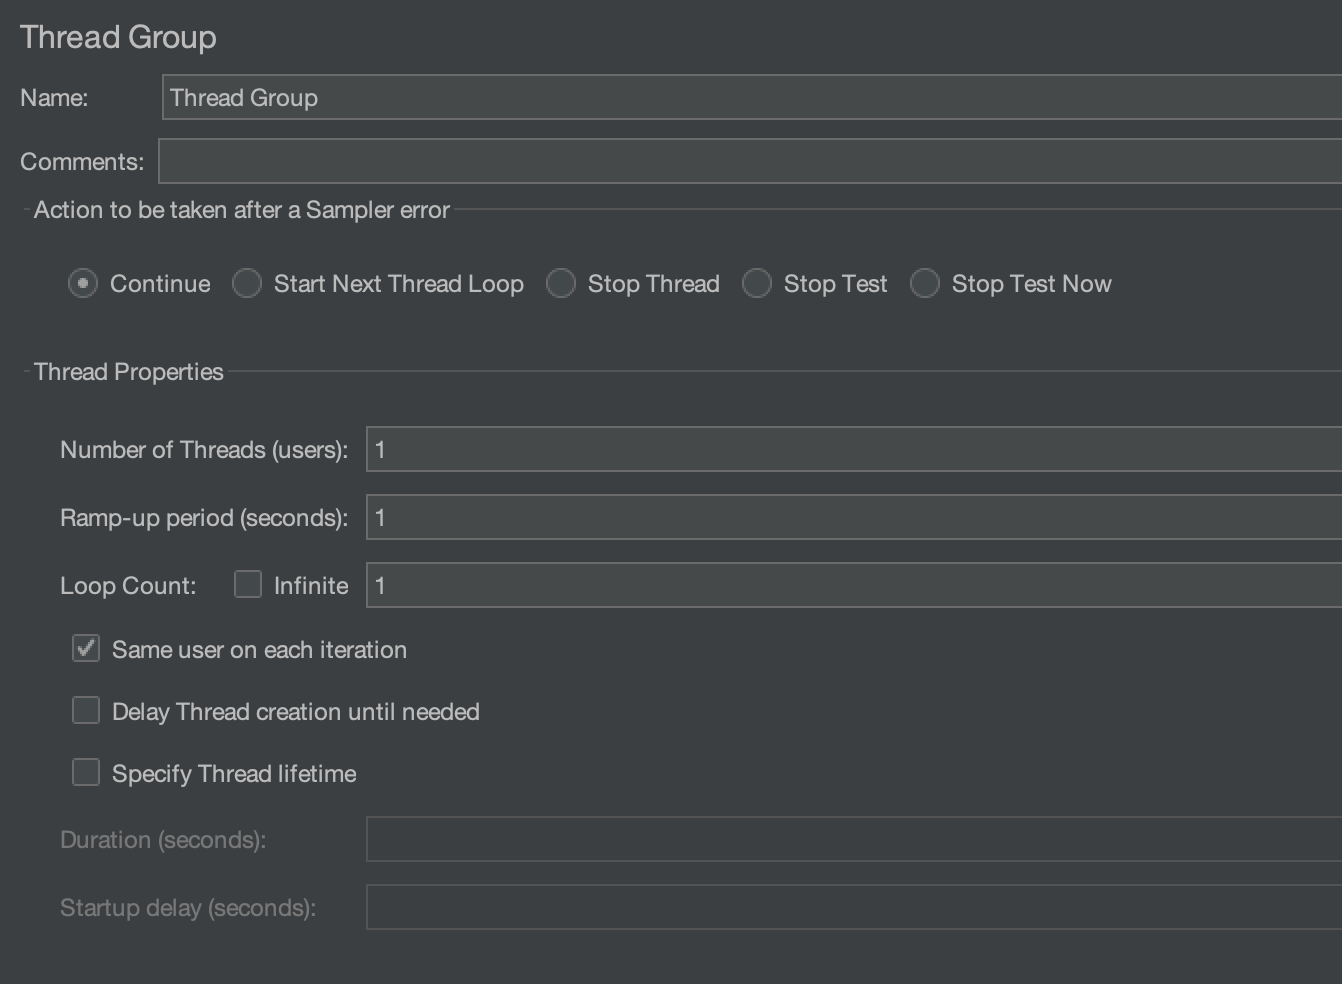
- To create a Thread group, simply go to “Add > Threads (Users) > Thread Groups”.

The Thread Group is used to execute a specific number of tests.

Add Throughput Controller
- Right-click on the Thread Group.
- And then go to “Add” > “Logic Controller” > “Throughput Controller.”

Throughput controller configuration
Below is the screenshot of the Throughput controller configuration page

Here, we can see multiple configurations
- Based on: It has two options – Percent Executions and Total Executions
- Per user
Let’s discuss both in detail so you know when to use what configuration.
Percent Executions
In this mode, we can specify the percentage of executions relative to the parent sampler or thread group.
- How It Works: If you set the Throughput to 50%, the requests inside the controller will execute half the time during the test run.
- Use Case: This is ideal when you want to simulate scenarios where certain actions are less frequent, such as a user checking out versus browsing.
Example
Let’s add an HTTP Sampler to execute two requests, where the first HTTP request will handle 40% of the traffic, and the second will handle 60%.
- For this, we will use 2 throughput controllers and add one HTTP sampler controller to each.
- One HTTP sampler will execute the “https://jsonplaceholder.typicode.com/posts/1,” and the second one will execute the “https://jsonplaceholder.typicode.com/posts/2” API.
So, let’s add an HTTP sampler to the 1st Throughput controller and execute the “https://jsonplaceholder.typicode.com/posts/1” API.
Add HTTP sampler

- Please enter “https” in the input box that is labelled “Protocol[http]:“.
- Enter “jsonplaceholder.typicode.com” in the input box labelled “Server Name or IP”.
- By default, the HTTP request value is set to GET. Since we are only executing a GET request, we won’t be changing it.
- Set the Path to “/posts/1“.
- Also, change the name of the HTTP request to “1st post“.

Add 2nd Throughput Controller with HTTP sampler
Now, do the same thing with the 2nd throughput controller. Just change the API to “https://jsonplaceholder.typicode.com/posts/2” and name to “2nd post“
This is what the Test Plan looks like –

Change the Percentages of both the ThroughtPut controllers
Now, change the Throughput of the first controller to 40 and the second controller to 60.


Add the Listener
Let’s add the Aggregate Report Listener to our test plan.

Now, run the Test Plan with 10 Threads and 10 Loop counts.

Below are the aggregate report results –

Here, we can see that 60 requests out of 100 went to 2nd post, whereas only 40 went to 1st post. This is how we can use percentage execution with the Throughput controller.
Total Executions
In this mode, we can specify the exact number of times the requests inside the controller should be executed, irrespective of the number of iterations or users in the test plan.
- How It Works: If you set a total execution count of 10, the controller will ensure its child requests execute exactly 10 times during the test.
- Use Case: This is useful when testing a fixed number of requests or simulating specific load patterns.
Let’s take the previous test plan and make some modifications.
Change the Loop count
Set the Loop Count to 5 to clearly demonstrate the functionality of Total Executions. If the Loop Count were kept at 10, the total number of requests would still be 100 (as before), and setting Total Executions to 40 would yield the same outcome as using the “Percent Execution” option.

Now, update both Throughput Controllers to use the “Total Executions” mode. Set the value of the first Throughput Controller to 40 and the second one to 10.


Run the Test Plan again
Now, run the Test Plan again and observe the aggregate report results

Here, we can see that the 1st throughput controller was executed 40 times, and the 2nd throughput controller was executed only 10 times. So, this is how we can control the execution of controllers using the “Total executions” in the Throughput controller.
Per user
By default, “Per User” checkbox is unchecked. So, what does it mean?
It means that the number given in the throughput controller will equal the number of executions made. So, if we have given 40 or 10 in the throughput controller, the child samplers will only be executed that many times.
But what if the “Per User” checkbox is checked?
Then, each user will perform the number of executions mentioned in the throughput controller. Let’s understand this with the help of an example.
Suppose the number of threads (users) mentioned in the thread was 4, and the total executions for the 1st controller were 40, and the 2nd controller was 10.
Each user will carry out 40 executions for the 1st controller and 10 for the 2nd controller, resulting in a total of 50 executions per user. With 4 users in total, this translates to 200 executions overall (160 for the 1st controller and 40 for the 2nd controller).
We can also try it out. So, let’s do that
Set the Number of Threads and Loop Count
Let’s set the number of threads as 4 and the Loop count as 50.

Check the “Per user” checkbox for both throughput controllers.


Run the Test Plan
Finally, run the test plan and observe the aggregate report result

We can see that the 1st controller was executed 160 times ( 4 users * 40 total executions of 1st controller ), and the 2nd controller was executed 40 times ( 4 users * 10 total executions of 1st controller ).
Video Tutorial
We hope that you have liked the article. If you have any doubts or concerns, please write to us in the comments or mail us at admin@codekru.com.
